ATO R&D Tax Incentive Transparency Report 2023–24: Key Findings and What They Mean for Australian Businesses

Bruce Murray · Manager, R&D and Government Incentives · 6 October 2026
Each year, the ATO's R&D Tax Incentive Transparency Report provides one of the clearest insights into how Australian businesses are investing in research and development.
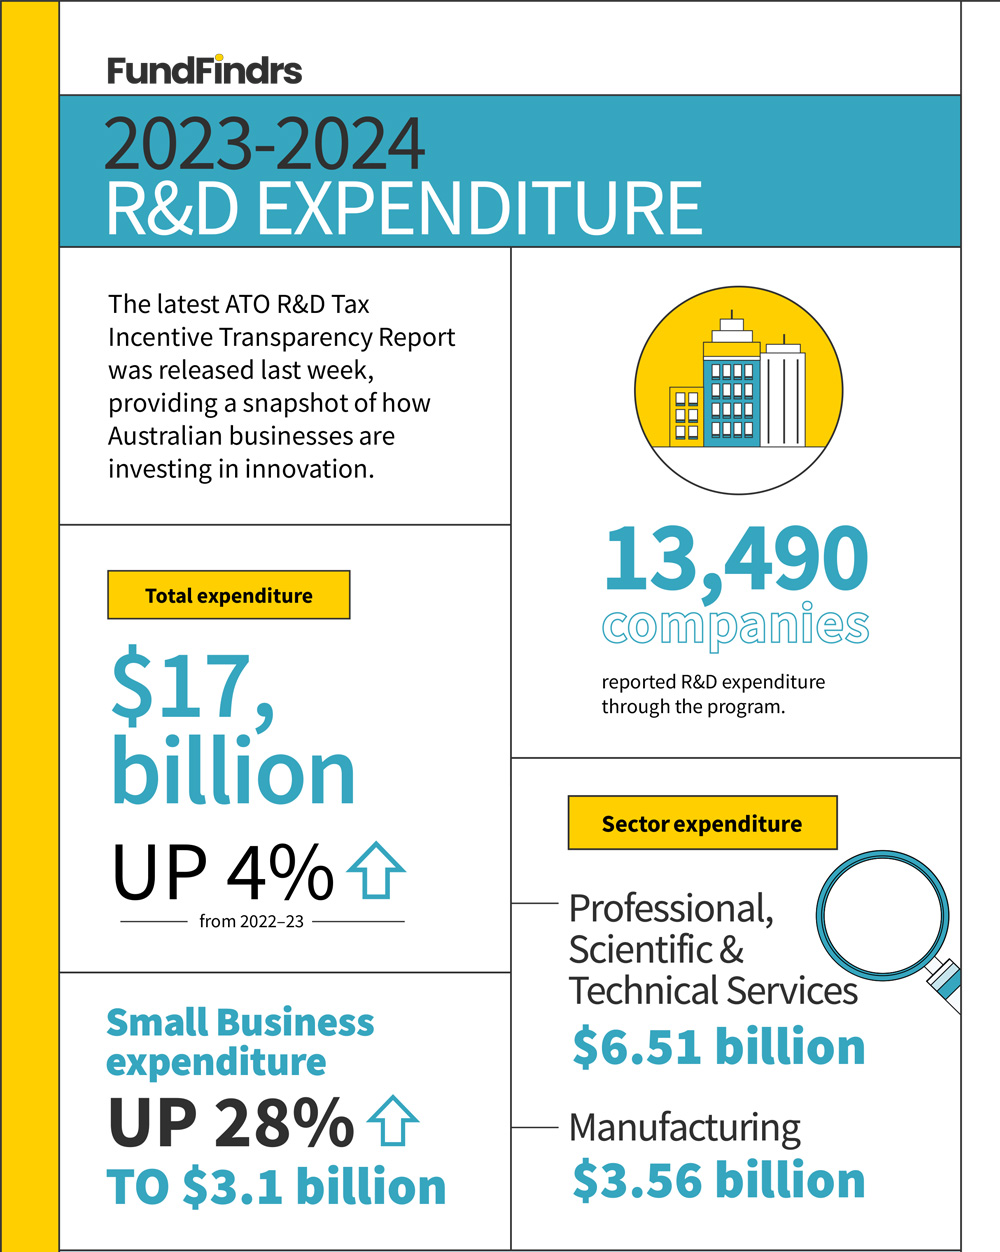
The 2023–24 report reveals that Australian businesses reported almost $17 billion in eligible R&D expenditure across 13,490 companies, providing an important snapshot of innovation activity across the economy.
But the real value of the report isn't simply the numbers themselves.
The report helps answer some important questions:
Is business investment in R&D increasing or decreasing?
Which industries are investing most heavily in innovation?
Who is participating in the R&D Tax Incentive?
What trends are emerging across the Australian innovation landscape?
What do these findings mean for businesses undertaking R&D?
In this article, we break down the key findings from the 2023–24 report and explain what they may mean for Australian businesses.
In this article:
What the data means for engineering, software and technology businesses
What the data means for life sciences and MedTech businesses
What the data means for businesses claiming the R&D Tax Incentive
Key takeaway
R&D investment increased in 2023–24. Both expenditure and claimant numbers increased year on year.
Almost $17 billion was reported across 13,490 companies. The R&D Tax Incentive continues to support innovation at scale.
Professional, Scientific and Technical Services led R&D investment. The sector reported $6.51 billion in expenditure and the largest year on year increase.
Manufacturing remained Australia's second-largest R&D sector. Despite a slight decline, it continues to be a major contributor to national innovation activity.
R&D expenditure is not the same as the R&D Tax Incentive benefit received. The report shows expenditure claimed, not the tax offset, refund or cash benefit ultimately received.
Key findings at a glance
Measure | 2023–24 |
|---|---|
Total R&D expenditure claimed | Almost $17 billion |
Number of companies | 13,490 |
Largest industry by expenditure | Professional, Scientific and Technical Services ($6.51 billion) |
Biggest industry increase | Professional, Scientific and Technical Services (+$313.0 million) |
Biggest industry decrease | Mining (-$108.7 million) |
Small business claimants | 6,920 |
Public and multinational businesses | 2,449 companies; $9 billion in R&D expenditure (54% of total expenditure) |
What is the R&D Tax Incentive Transparency Report?
The R&D Tax Incentive Transparency Report is published annually by the Australian Taxation Office (ATO) and provides information about R&D expenditure reported through the R&D Tax Incentive program.
The report is designed to improve transparency and public understanding of participation in the program by publishing aggregated data and company-level expenditure information, as well as the R&D expenditure claimed during the reported period.
It's important to clarify that the report does not show:
The tax offset received by a company
The cash refund received by a company
Whether a company's claim was reviewed
Whether a company's activities were successful
Because of this, the report should be viewed as an insight into R&D investment activity, rather than a measure of commercial success or government support received.
How much R&D expenditure was claimed in 2023–24?
According to the report:
Australian businesses reported almost $17 billion in R&D expenditure
This represents a 3% increase compared with 2022–23
The number of participating companies was 13,490
Claimant numbers were higher than the previous year
Compared with 2022–23, these figures suggest an increase in both total R&D expenditure and the number of participating companies.
The direction of movement is important because it provides insight into how Australian businesses are prioritising investment in product development, process improvement, software, manufacturing innovation and emerging technologies.
Which businesses claimed the R&D Tax Incentive in 2023–24?
One of the most useful insights from the report is the breakdown of claimant types.
In 2023–24:
Small-business claimants represented 51%
Privately owned and wealthy groups represented 31%
Public and multinational businesses represented 18%
This distribution highlights an important characteristic of the Australian innovation ecosystem.
For founders and growing businesses, it reinforces that the program is not limited to large corporations. For larger claimants, it demonstrates the continued importance of structured R&D investment across mature businesses and established industry sectors.
Which industries reported the highest R&D expenditure?
Industry data is often where the most interesting stories emerge.
The 2023–24 report shows:
Professional, Scientific and Technical Services recorded total R&D expenditure of $6.51 billion
Manufacturing reported $3.56 billion
Agriculture, Forestry and Fishing reported $412.8 million
Health Care and Social Assistance reported $297.0 million
However, rankings alone rarely tell the full story. The more meaningful question is: Where is R&D investment growing?
The industries recording the largest increases were:
Professional, Scientific and Technical Services (+$313.0 million)
Financial and Insurance Services (+$90.4 million)
Electricity, Gas, Water and Waste Services (+$69.5 million)
The industries recording the largest declines were:
Mining (-$108.7 million)
Arts and Recreation Services (-$22.5 million)
Manufacturing (-$15.0 million)
These movements can provide useful insight into changing market conditions, investment priorities and innovation activity across the economy.
What the data means for manufacturers
Manufacturing remains one of Australia's most significant R&D sectors.
Whether developing new products, automating production processes, improving materials or increasing operational efficiency, manufacturers continue to undertake substantial technical development activities.
While manufacturing expenditure decreased slightly from $3.57 billion in 2022–23 to $3.56 billion in 2023–24, the sector remained Australia's second-largest R&D industry by expenditure. This level of consistency suggests that innovation continues to be embedded within manufacturing businesses, even as economic conditions and investment priorities evolve.
The report also reinforces that Australia's innovation activity is not limited to software, technology startups or emerging industries. Manufacturing continues to account for a significant share of national R&D expenditure, highlighting the important role product development, process innovation, automation and technical problem-solving play in maintaining competitiveness across the sector.
What the data means for engineering, software and technology businesses
Many engineering, software and technology businesses undertake activities that involve technical uncertainty, experimentation and the development of new knowledge.
As investment in digital transformation, automation, AI and industrial technology continues to accelerate, this sector remains an important contributor to Australia's innovation ecosystem.
Professional, Scientific and Technical Services remained Australia's largest R&D sector in 2023–24, reporting $6.51 billion in R&D expenditure and recording the largest increase in expenditure of any industry. This continued growth reflects the significant role knowledge-intensive industries play within the Australian economy and aligns with broader global trends, where investment in software, data, automation, advanced technologies and digital capability continues to shape business competitiveness.
For businesses operating in engineering, software and technology-related fields, the findings reinforce that innovation remains a major area of investment, with organisations continuing to develop new products, improve existing technologies and pursue technical solutions to increasingly complex business challenges.
What the data means for AgTech businesses
The agriculture sector continues to face pressure to improve productivity, sustainability and resilience.
Innovation in agricultural systems, equipment, data analytics, biotechnology and food production continues to drive significant R&D activity.
The 2023–24 report shows Agriculture, Forestry and Fishing reported approximately $413 million in R&D expenditure, up from approximately $399 million in 2022–23. While the sector represents a relatively small share of Australia's total R&D expenditure, the year on year growth indicates businesses continue to invest in developing and improving agricultural technologies, products and processes.
For AgTech businesses, this reinforces that research and development remains an important part of addressing industry challenges and developing new solutions for producers, processors and the broader agricultural supply chain.
What the data means for life sciences and MedTech businesses
Life sciences, biotechnology and medical technology organisations often undertake some of the most technically challenging R&D activities conducted in Australia.
Developing new therapies, devices, diagnostics and healthcare technologies requires substantial investment, long development cycles and rigorous testing.
The 2023–24 report shows Health Care and Social Assistance reported approximately $297 million in R&D expenditure, up from approximately $266 million in the previous year. While the sector represents a smaller share of total R&D expenditure than some of Australia's largest R&D industries, the year on year increase demonstrates continued investment in healthcare innovation and the development of new technologies, products and services.
What the transparency report does not tell you
One of the most common misconceptions about the report is that it shows the financial benefit received by companies. It does not.
The report publishes expenditure claimed under the R&D Tax Incentive program, not the tax offset, refund or cash benefit ultimately received.
The report also does not explain:
Why expenditure increased or decreased
Whether projects were commercially successful
Whether a claim was reviewed
The complexity of the underlying R&D activities
The quality of supporting documentation
How well a business prepared its claim
For these reasons, businesses should be careful not to draw conclusions based solely on expenditure figures.
What the 2023–24 R&DTI data means for businesses claiming the R&D Tax Incentive
Regardless of the specific figures released this year, the report reinforces several important themes.
Businesses undertaking R&D should focus on:
Identifying eligible activities early
Maintaining contemporaneous records
Aligning technical and financial documentation
Demonstrating technical uncertainty and experimentation
Building evidence progressively throughout the year rather than retrospectively
As transparency around the program continues to increase, strong documentation and clear claim methodology become increasingly important.
Final thoughts
The 2023–24 R&D Tax Incentive Transparency Report provides an important snapshot of how Australian businesses are investing in innovation.
The headline figures tell us where R&D expenditure is being reported. The real value lies in understanding the trends behind those numbers and what they reveal about changing industry priorities, claimant behaviour and the broader innovation landscape.
At FundFindrs, we believe the most successful R&D claimants are not necessarily those spending the most. They are the businesses that understand the program requirements, maintain strong evidence and take a strategic approach to innovation funding.
As the latest transparency data demonstrates, Australian businesses continue to invest heavily in research and development. Understanding how your organisation fits within that landscape is the first step to maximising the value of your R&D activities.
Need help with your R&D Tax Incentive claim?
Whether you're preparing your first claim, reviewing an existing approach or planning future R&D projects, the FundFindrs team can help.
Take our R&D Tax Incentive Eligibility Test or speak with one of our advisers to discuss your activities.
About the author
Bruce Murray
Manager, R&D and Government Incentives
With decades of experience in audit and risk, assessing and approving R&DTI applications with AusIndustry, guiding and supporting businesses through the entire application process, Bruce Murray has supported over 100 FundFindrs clients across manufacturing, pharmaceutical, technology, and other industries, bringing practical insight into a wide range of innovation scenarios. Together with the FundFindrs team, he has also achieved a 100% success rate on eligible R&DTI applications, reflecting a consistent, high-quality approach to assessment and submission.
Frequently asked questions
What is the R&D Tax Incentive Transparency Report?
Does the report show how much money companies received?
Why is my company listed in the report?
Is R&D expenditure the same as an R&D Tax Incentive refund?
Which industries claim the most R&D expenditure?
Can small businesses access the R&D Tax Incentive?
Related articles

The Australian Business Funding Roadmap: 7 Funding Pathways and How to Combine Them
Explore seven funding pathways available to Australian businesses and learn how grants, the R&D Tax Incentive, debt and investment can work together to support growth.

How to Prepare Your FY26 R&D Tax Incentive Claim
Preparing an FY26 R&D Tax Incentive claim involves more than identifying eligible activities. This guide outlines the key requirements, including entity eligibility, documentation, expenditure tracking and proposed program changes, helping Australian businesses strengthen their R&DTI claims and improve compliance.